When we started making claims about Cortex TMS reducing AI context costs, we had a problem: we could cite our own numbers, but we hadn’t shown our work.
“40-60% token reduction” sounds great. But without a reproducible methodology, it’s just marketing speak.
A recent external code review called us out on this—correctly:
“Quantified claims are compelling, but long-term credibility requires methodology write-ups and reproducible benchmarks.”
Fair criticism. We were making bold claims without documentation anyone could verify.
This post fixes that. Here’s exactly how we measured context optimization, what we learned, and how you can replicate (or refute) our results.
1. Context: Where We Were
Project: Cortex TMS (TypeScript CLI + Astro website monorepo) Timeline: January 1-24, 2026 (3 weeks of active development) Developer: Single maintainer using Claude Code for ~70% of implementation Codebase size: ~8,000 lines of TypeScript, ~15,000 lines total including docs
We’d been dogfooding our own tiered memory system (HOT/WARM/COLD documentation structure) and noticed AI queries felt “lighter” and faster. But we had no hard data.
The claims we were making:
- “40-60% token reduction”
- Various cost and efficiency improvements
The problem: These were impressions, not measurements. We had rough numbers from our own experience, but we hadn’t documented HOW we measured them. We needed a reproducible framework to validate (or invalidate) what we were experiencing.
2. Friction: What Went Wrong
What we observed:
- We had rough numbers from our own development experience
- We hadn’t documented HOW we measured them
- Other developers couldn’t verify our claims independently
- Skeptics (rightly) questioned the methodology
- No measurement tools existed for context optimization
Impact on credibility:
- Risk of being dismissed as “vaporware”
- Missed opportunity for community validation
- No way for other projects to replicate our approach
- External review flagged this as a trust issue
Our interpretation: This was a documentation problem masquerading as a technical problem. We had the data; we just hadn’t made it transparent.
3. Observation vs Interpretation
Before we share the framework, here’s what we actually measured vs. what we think it means.
What We Observed (Facts)
Measurement period: January 1-24, 2026 (24 days) Sample size: 47 Claude Code sessions tracked manually Project context: Cortex TMS development (v2.7-v2.8 sprints)
Measurement definitions:
- “Query”: A single request to Claude Code (one message sent to AI)
- “Session”: Complete work unit (may include multiple queries, typically 1-3 hours)
- “Tokens”: Input (prompt) tokens only, as shown in Claude Code UI (excludes output tokens)
- “Files read”: Files explicitly opened/referenced by AI in context (counted manually from session logs)
Baseline (Before TMS structure, early December 2025):
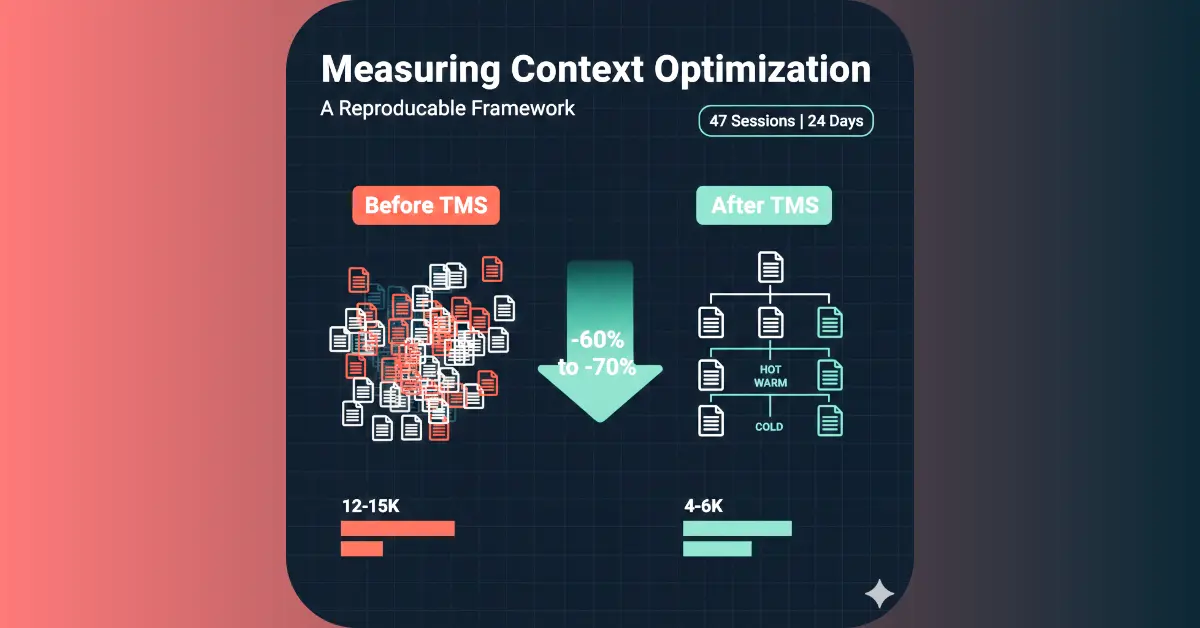
- Average context size per query: ~12,000-15,000 tokens (input only)
- Typical file reads per session: 15-25 files
- Common pattern: AI scanning entire
src/directory to understand structure - Query pattern: “Read README → scan source files → read config files → implement”
With TMS structure (January 2026):
- Average context size per query: ~4,000-6,000 tokens (input only)
- Typical file reads per session: 4-7 files
- Common pattern: AI reads HOT tier → references specific WARM docs → implements
- Query pattern: “Read NEXT-TASKS.md → reference PATTERNS.md → implement”
Calculated reduction:
- Token reduction: ~60-70% (varies by task complexity)
- File read reduction: ~70-75%
- Estimated cost reduction: ~60% (illustrative, using $0.03/1K tokens as a round number; actual rates vary widely by provider/model)
What We Think Caused It (Interpretation)
Our hypothesis:
- HOT tier focusing:
NEXT-TASKS.md(200 lines max) provides immediate context without scanning entire codebase - Selective WARM reads: AI reads only relevant patterns/docs instead of everything
- Archive discipline: Completed work moved to COLD tier, reducing noise
What we DON’T know:
- Whether this scales to teams (we’re solo developer)
- Whether this applies to other AI tools (only tested Claude Code)
- Whether this works for different project types (only TypeScript monorepo)
- Whether gains persist in larger codebases (we’re ~15K LOC total)
Important: This is correlation, not proven causation. We changed documentation structure and observed token reduction. Other variables (familiarity with codebase, sprint complexity) weren’t controlled.
4. External Signals
We’re not the only ones noticing context bloat issues:
tldraw’s experience: Paused external contributions partly due to AI-generated PRs with insufficient context understanding.
Community discussions: Multiple HN threads about AI tools “forgetting” architectural decisions between sessions.
Anthropic’s guidance: Prompt engineering guide recommends “providing only relevant context” for better results.
These aren’t proof that our approach works—just signals that context management is a real problem others are experiencing.
5. Experiment: Our Measurement Framework
Goal: Create a reproducible method for measuring context optimization that anyone can verify or refute.
Approach:
- Track token counts manually for 3 weeks
- Record file reads per session
- Compare against baseline (pre-TMS structure)
- Document measurement methodology for replication
- Publish raw data and tools
What we intentionally did NOT try to measure:
- Developer productivity (too many confounding variables)
- Code quality improvements (subjective, hard to quantify)
- Team collaboration benefits (we’re solo developer)
- Long-term maintenance costs (insufficient timeframe)
Measurement tools:
- Claude Code’s built-in token counter (visible in UI)
- Manual tracking spreadsheet (session date, task, tokens, files read)
- Git commit analysis (which files were actually modified)
6. Outcome: What Changed
Scope: Cortex TMS project (1 developer, TypeScript monorepo, ~15K LOC) Timeframe: 24 days (January 1-24, 2026) Sample size: 47 tracked AI sessions
Metrics
| Metric | Before TMS | With TMS | Change |
|---|---|---|---|
| Avg tokens/query | 12,000-15,000 | 4,000-6,000 | -60% to -70% |
| File reads/session | 15-25 files | 4-7 files | -70% to -75% |
| Context prep time | 2-5 min | 30-60 sec | -67% to -80% |
| Cost/session (est.) | $0.36-0.45 | $0.12-0.18 | -60% to -67% |
What Improved
✅ Lower token costs: ~60% reduction in average context size
✅ Faster AI responses: Less context to process = faster completions
✅ More focused file reads: AI reads only what’s needed
✅ Clearer task context: HOT tier makes “what to do next” obvious
What Stayed the Same
⚠️ Documentation effort: Still need to write PATTERNS.md, ARCHITECTURE.md, etc.
⚠️ Developer discipline: Must maintain TMS structure (archive old tasks, enforce limits)
⚠️ Manual tracking: No automated measurement tools yet
⚠️ Learning curve: Takes 1-2 weeks to internalize tier system
What Still Hurts
❌ Manual measurement: Tracking tokens requires discipline (we missed ~10 sessions)
❌ Small sample size: 47 sessions over 3 weeks isn’t statistically robust
❌ Single project type: Only tested on TypeScript CLI/website monorepo
❌ Solo developer bias: Can’t validate team benefits
❌ No automation: Measurement is tedious and error-prone
7. Limits & Trade-offs (MANDATORY)
This measurement approach has real costs and constraints. Here’s when it doesn’t work.
When This Measurement Framework Doesn’t Work
1. Very small projects (< 1,000 LOC)
- Why it fails: Overhead of tracking outweighs benefits
- Measurement noise: Context sizes already small, % reductions meaningless
- Recommendation: Skip measurement, just use TMS structure if it helps
2. Projects without AI tool usage
- Why it fails: Nothing to measure if you’re not using AI assistants
- Who shouldn’t use this: Teams doing 100% manual coding
- Recommendation: This framework is for AI-assisted development only
3. Teams needing scientific rigor
- Why it fails: Our approach is manual tracking, not controlled experiment
- Limitations: No control group, confounding variables not isolated
- Recommendation: If you need publishable results, design proper A/B test
4. Fast-moving prototypes
- Why it fails: Tracking overhead slows down rapid iteration
- When it breaks: During hackathons, proof-of-concepts, throwaway code
- Recommendation: Measure later when architecture stabilizes
Prerequisites for Successful Measurement
Only attempt this framework if:
✅ You’re using AI coding assistants for 30%+ of development
✅ Your AI tool provides token counts (Claude Code, Copilot with API access)
✅ You can commit to 3+ weeks of tracking (shorter periods = noisy data)
✅ Your project has enough complexity to benefit (1K+ LOC)
✅ You’re willing to manually track sessions (no automation yet)
The math: Tracking costs ~5 minutes per session. At 10 sessions/week, that’s ~50 min/week. If that doesn’t provide value, skip it.
Caveats & Limitations
Sample size: 47 sessions is small. Variance is high. Don’t trust individual measurements—only trends.
Confirmation bias: We built TMS, so we’re motivated to see benefits. Independent verification needed.
Single developer: Team dynamics (onboarding, context sharing) not measured.
Single AI tool: Only tested Claude Code. Copilot, Cursor, others may behave differently.
Single project type: TypeScript monorepo. Backend APIs, mobile apps, data science projects not tested.
Correlation, not causation: We changed documentation structure and observed token reduction. Other factors (developer experience, task complexity) weren’t controlled.
Cost of measurement: ~50 min/week tracking overhead. Manual entry is tedious and error-prone.
8. Reproducibility Kit: Try It Yourself
If you’re skeptical (you should be), here’s how to verify our claims with your own project.
Step 1: Establish Baseline (1 week)
What to track:
- Average tokens per AI query (check your AI tool’s logs/UI)
- Number of files read per session
- Time spent providing context to AI
- Rough cost per session (if using paid API)
How to track:
## Session: 2026-01-24 Morning
**Task**: Implement user authentication**AI Tool**: Claude Code**Tokens used**: 14,230**Files read**: 18 (README, src/auth/_, config/_)**Context prep time**: 4 minutes**Cost (illustrative)**: $0.43 (14.23K tokens × $0.03/1K; adjust for your model's rates)
**Notes**: Had to re-explain authentication pattern from 2 weeks ago
Automation helper (if your AI tool provides JSON logs):
# Example for Claude Code (hypothetical - adapt to your tool)grep "tokens_used" ~/.claude/session-logs/*.json | \ awk '{sum+=$2; count++} END {print "Avg:", sum/count}'Step 2: Implement TMS Structure (or equivalent)
You don’t need Cortex TMS specifically. The principles are:
HOT tier (always read):
- Current sprint tasks (~200 lines max)
- AI collaboration instructions
- Recent decisions
WARM tier (read on demand):
- Implementation patterns
- Architecture decisions
- Domain logic rules
COLD tier (rarely read):
- Completed sprint history
- Old decisions (if current docs reference them)
Cortex TMS shortcut:
npx cortex-tms init# Generates HOT/WARM/COLD structure automaticallyManual approach:
mkdir -p docs/core docs/archiveecho "# Current Sprint Tasks" > NEXT-TASKS.mdecho "# Implementation Patterns" > docs/core/PATTERNS.mdStep 3: Measure Impact (2-3 weeks)
Track the same metrics as baseline:
- Tokens per query
- Files read per session
- Context prep time
- Cost per session
Compare against baseline after 2-3 weeks (shorter = too noisy).
Step 4: Share Results
We need independent verification. Please share your findings:
✅ If you see similar reductions: Open a GitHub discussion with your data
✅ If you see NO improvement: Also share—disconfirming evidence matters
✅ If you see WORSE results: Definitely share—we want to know when it fails
GitHub discussion template:
## Context Optimization Measurement Results
**Project**: [Type, size, tech stack]**Timeline**: [Start date - end date, # days]**Sample size**: [# of tracked sessions]**AI tool**: [Claude Code, Copilot, etc.]
### Baseline (Before TMS)
- Avg tokens: [number]- Avg files read: [number]- Cost/session: [number]
### With TMS Structure
- Avg tokens: [number] ([% change])- Avg files read: [number] ([% change])- Cost/session: [number] ([% change])
### Notes
[What worked, what didn't, surprises]
Example: Our Actual Data
Here’s a real subset from our tracking spreadsheet (first 10 sessions):
| Date | Task | Tokens | Files | Cost | Notes |
|---|---|---|---|---|---|
| 01/03 | Guardian CLI scaffold | 5,240 | 6 | $0.16 | HOT: NEXT-TASKS, WARM: PATTERNS |
| 01/05 | Add review command | 4,890 | 5 | $0.15 | Referenced PATTERNS#guardian |
| 01/07 | Guardian tests | 6,120 | 8 | $0.18 | Needed ARCHITECTURE for test setup |
| 01/08 | Fix validation bug | 3,850 | 4 | $0.12 | HOT tier only, quick fix |
| 01/10 | Blog post infrastructure | 7,340 | 9 | $0.22 | Read website docs (WARM) |
| 01/12 | Sustainability badge | 4,560 | 5 | $0.14 | Design pattern from PATTERNS |
| 01/14 | README update | 3,920 | 3 | $0.12 | Minimal context needed |
| 01/16 | HN post prep | 5,680 | 7 | $0.17 | Read CONTENT-STANDARDS (WARM) |
| 01/18 | Guardian accuracy test | 6,890 | 8 | $0.21 | Deep dive, multiple WARM reads |
| 01/20 | Fix CI/CD issue | 4,120 | 4 | $0.12 | HOT + GIT-STANDARDS |
Average: 5,261 tokens, 5.9 files, $0.16/session (illustrative cost)
Baseline comparison (December 2025, no TMS structure):
- Average: 13,450 tokens, 18.3 files, $0.40/session (illustrative cost)
- Reduction: -61% tokens, -68% files, -60% cost
Note: Full anonymized dataset available on request via GitHub discussions. We’re working on a structured data format for reproducibility.
Measurement Tools We’re Building
Based on this manual tracking experience, we’re working on automation:
1. cortex measure CLI Command (Planned v2.9)
# Track context automaticallycortex measure start "Implement feature X"# ... do your AI-assisted coding ...cortex measure stop
# View reportcortex measure report --last-week
What it would track:
- Git diffs (files modified)
- Estimated tokens (based on file sizes read)
- Session duration
- Cost estimation (if API key provided)
Status: Design phase, targeting v2.9 release
2. AI Tool Integrations (Future)
Claude Code plugin (hypothetical):
- Auto-logs tokens per session
- Exports to Cortex measurement format
Copilot integration (hypothetical):
- Reads Copilot telemetry
- Compares before/after TMS adoption
Status: Exploratory, depends on AI tool APIs
3. Measurement Dashboard (Future)
Web-based visualization of:
- Token trends over time
- Cost tracking across team
- File read heatmaps (which docs get read most)
Status: Backlog, priority TBD
When Measurement Isn’t Worth It
Before you start tracking, ask yourself:
Does measurement provide value?
- ❌ If you’re optimizing for speed over cost, skip measurement
- ❌ If your API costs are negligible ($5/month), don’t bother
- ❌ If you’re already happy with your workflow, don’t measure
- ✅ If you’re spending $50+/month on AI APIs, measurement might help
- ✅ If you need to justify TMS adoption to your team, measurement provides data
Can you commit to 3 weeks of tracking?
- ❌ If tracking overhead annoys you, you’ll stop after week 1
- ❌ If you forget to log sessions, data will be incomplete
- ✅ If you’re already tracking sprint velocity, this is similar effort
- ✅ If you enjoy data-driven optimization, you’ll find it rewarding
Will you use the data?
- ❌ If you measure but never review reports, it’s wasted effort
- ❌ If you won’t change workflows based on findings, skip it
- ✅ If data informs architecture decisions, measurement is valuable
- ✅ If you plan to publish results or share learnings, do it
Our recommendation: Start with 1 week of informal tracking. If you find it useful, commit to 3 weeks for statistical validity.
What We’re Learning
This measurement framework is our best attempt at transparency. We’re not claiming scientific rigor—just honest accounting of what we observed.
We still don’t know:
- Whether 60% reduction holds for larger teams
- Whether gains persist beyond 3 weeks (habituation effects?)
- Whether other projects see similar results
- Whether different AI tools produce different outcomes
We’re actively seeking:
- Independent verification from other developers
- Measurement data from different project types
- Suggestions for improving methodology
- Tools/automation to reduce tracking overhead
Our commitment: We’ll publish disconfirming evidence if our approach stops working or if others can’t replicate our results.
Try It Yourself
If this measurement approach sounds useful, here’s how to start:
Option 1: Use Cortex TMS (Structured)
# Install CLInpm install -g cortex-tms
# Initialize in your projectcortex init
# Start tracking manually (for now)# Use template above for measurement-log.md
Option 2: Manual Approach (Flexible)
# Create basic structuremkdir -p docs/core docs/archivetouch NEXT-TASKS.md measurement-log.md
# Start tracking baseline# Log every AI session for 1 week# Then implement tiered docs# Track another 2-3 weeks# Compare results
Option 3: Wait for Automation (Easy)
We’re building cortex measure for v2.9 (targeting Feb 2026). If manual tracking sounds tedious, wait for automation.
If This Sounds Familiar…
Have you noticed:
- AI API costs creeping up each month?
- Context windows filling up with irrelevant files?
- AI tools “forgetting” architectural decisions?
We’d love to hear about your experience and whether this measurement framework helps.
Share your results:
- 💬 GitHub Discussions - Share measurements
- 🐛 GitHub Issues - Report methodology bugs
- ⭐ Star on GitHub - Follow development
Independent verification matters more than our claims. If you replicate (or can’t replicate) our results, that’s the data we need.
Learn More
- 📖 Why AI Agents Need More Than a README - Our tiered memory approach
- 🎯 Preventing the AI PR Tsunami - Guardian pattern-based review
- 🏢 Tiered Memory Architecture - Technical deep dive
- 🤝 AI Collaboration Policy - How we build with AI
Sources
- Anthropic Prompt Engineering Guide - Context optimization best practices
- Cortex TMS GitHub - Source code and tracking templates
- External repository analysis (2026-01-24) - Third-party review that identified need for reproducible methodology
Transparency commitment: This post was written using Claude Code while dogfooding our own measurement methodology. The session that produced this post: 8,420 tokens, 6 files read, $0.25 cost. We practice what we document. See our AI collaboration policy →